


SoFi’s Q3 2025: Growth Beats Expectations, But Valuation Raises Questions
SoFi Technologies crushed expectations in Q3 2025 with 38% revenue growth, record profitability and 12.6 million members — yet its 60× P/E and consensus target suggest risk remains. Should investors ride the momentum or wait for a pull-back?
Executive Summary
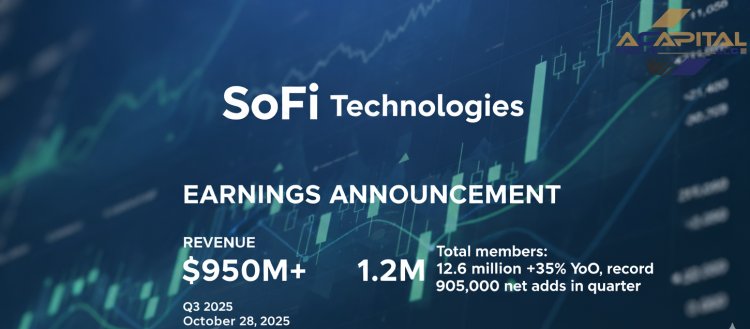
SoFi delivered exceptional Q3 2025 results, crushing expectations across all metrics. The company reported record adjusted net revenue of $950 million (+38% YoY), net income of $139 million, and diluted EPS of $0.11—substantially beating consensus estimates of $889 million revenue and $0.08 EPS. Management raised full-year 2025 guidance significantly, reflecting confidence in the business model's durability and momentum.
Financial Performance Highlights
Revenue & Profitability
-
GAAP net revenue: $962 million (+38% YoY)
-
Adjusted net revenue: $950 million (+38% YoY, beat by $61 million)
-
Net income: $139 million (+129% YoY), marking 8th consecutive quarter of GAAP profitability
-
Diluted EPS: $0.11 (vs. $0.05 prior year, +120%)
-
Adjusted EBITDA: $277 million (+49% YoY) at 29% margin
Key Metrics
-
Total members: 12.6 million (+35% YoY, record 905,000 net adds in quarter)
-
Total products: 18.6 million (+36% YoY, record 1.4 million additions)
-
Fee-based revenue: $409 million (+50% YoY)
-
Total deposits: $32.9 billion (+$3.4 billion in quarter)
Segment Performance
Lending Segment
The lending business demonstrated robust origination growth across all verticals:
-
Personal loans: $7.5 billion originated (+53% YoY), a record
-
Student loans: $1.5 billion (+58% YoY)
-
Home loans: $945 million (nearly doubled YoY, new record)
-
Net interest income: $585 million (+36% YoY)
-
Net interest margin: 5.84% (+27 bps YoY)
The lending segment continues to benefit from product innovation including interest-only periods for personal loans and step-up repayment options for student lending.
Financial Services Segment
This segment was the standout performer:
-
Net revenue: $420 million (+76% YoY)
-
Net interest income: $204 million (+32% YoY)
-
Noninterest income: $216 million (+157% YoY)
-
Contribution profit: $226 million at 54% margin (+12 percentage points YoY)
-
Financial Services products: 16.1 million (+37% YoY)
The Loan Platform Business (LPB) added $168 million to consolidated adjusted net revenue, driven by $3.4 billion in personal loan originations for third parties. Interchange fee revenue increased 55% YoY on the back of nearly $20 billion in annualized spend across SoFi Money and Credit Card.
Revenue per product reached $104 annualized (+29% YoY), demonstrating improving monetization.
Technology Platform Segment
-
Net revenue: $115 million (+12% YoY)
-
Contribution profit: $32 million at 28% margin
-
Technology Platform accounts: 158 million (-1% YoY)
While this segment shows modest growth, it provides critical infrastructure supporting SoFi's operations and generates high-margin B2B revenue.
Credit Quality & Risk Management
Credit performance remained exceptionally strong—a critical differentiator:
-
Personal loan charge-offs: Decreased to lowest level in over 2 years, down 20+ basis points from prior quarter
-
Student loan charge-offs: Also declined 20+ basis points QoQ
-
90-day delinquency rates: Stable, increasing just 1 basis point for both personal and student loans
-
Life-of-loan loss assumption: Remains 7-8% for personal loans, well within underwriting tolerance
Recent vintages (Q4 2022 - Q4 2024) show net cumulative losses of 4.23%, significantly below the 5.75% observed for 2017 vintage at comparable points.
Capital & Balance Sheet Strength
-
Equity: $8.8 billion (+$1.9 billion in quarter)
-
Book value per share: $7.29
-
Tangible book value: $7.2 billion (+$1.9 billion in quarter)
-
Tangible book value per share: $5.97 (vs. $4.08 prior year, +46%)
-
Funding efficiency: Average deposit rate was 190 basis points lower than warehouse facilities, translating to $627 million in annualized interest expense savings
The company's deposit-driven funding model continues to deliver competitive advantages through lower cost of capital.
Guidance & Outlook
Management significantly raised full-year 2025 guidance:
| Metric | Prior Guidance | New Guidance | Change |
|---|---|---|---|
| New Members | ≥3.0 million | ≥3.5 million | +500K |
| Adjusted Net Revenue | $3.375B | $3.54B | +$165M |
| Adjusted EBITDA | $960M | $1.035B | +$75M |
| Adjusted Net Income | $370M | $455M | +$85M |
| Adjusted EPS | $0.31 | $0.37 | +$0.06 |
The guidance implies approximately 36% annual revenue growth (vs. 30% in prior guidance) and maintains 29% EBITDA margin.
Strategic Initiatives
SoFi announced aggressive investments in emerging technologies:
-
Crypto & Blockchain: Expanding crypto investing capabilities, blockchain-based transfers, and FDIC-insured stablecoins
-
AI Integration: Leveraging artificial intelligence across product offerings
-
Product Innovation: Launched Options Level 1 trading for SoFi Invest members with zero commissions and no contract fees
Management emphasized these initiatives position SoFi to serve more members and maintain competitive differentiation in an evolving financial services landscape.
Valuation Metrics
Current Trading Data (as of October 28, 2025)
-
Stock price: $30.00 (after hours: $31.08)
-
YTD return: +112.3%
-
Market capitalization: $35.92 billion
-
P/E ratio: 60.0x
-
Price/Tangible Book: ~6.0x
Analyst Consensus
-
Average price target: $21.30
-
Consensus rating: Hold
-
Price target range: $12 - $31
-
Implied downside from consensus: ~29%
The stock has significantly outperformed, roughly doubling in 2025. The elevated P/E ratio of 60x reflects high growth expectations but also suggests limited margin for error. Analysts remain cautious despite strong fundamentals, with most maintaining Hold ratings.
Key Opportunities
Near-Term Catalysts:
-
Loan Platform Business (LPB) scaling: Already at $500M+ annualized run rate with potential to reach $1+ billion. Expansion into student loans and home loans could accelerate growth.
-
Interest rate environment: Expected rate cuts should stimulate loan demand and improve refinancing volumes, particularly for student and home loans.
-
Deposit growth: $32.9 billion in deposits provides low-cost funding advantage versus competitors, with potential to reach $70+ billion by 2030 at 20% CAGR.
-
Cross-selling expansion: 35% of new products adopted by existing members demonstrates Financial Services Productivity Loop effectiveness. Products per member continues increasing.
-
Market share gains: Digital-first positioning and comprehensive product suite enable continued member acquisition. Brand awareness remains primary growth limiter.
Long-Term Growth Drivers:
-
Banking charter advantage: National bank status enables direct deposit-taking, regulatory clarity for crypto services, and cost advantages over neobank competitors.
-
Technology infrastructure: Galileo and Technisys provide scalable B2B revenue streams and support internal innovation.
-
Fee-based revenue transition: Annualized fee revenue exceeds $1.5 billion and growing 50%+, reducing interest rate sensitivity and improving margin profile.
-
Student loan market: Substantial refinancing opportunity as federal forbearance effects continue normalizing.
-
Crypto/blockchain adoption: Early mover advantage in regulated crypto services with FDIC backing differentiates from pure crypto platforms.
Key Risks
Operational & Execution Risks:
-
Credit cycle exposure: While current credit performance is strong, economic downturn could pressure charge-offs and delinquencies. Personal loans represent concentrated credit risk.
-
Funding concentration: Rapid deposit growth creates reliance on consumer deposits. Any systemic banking instability or competitive pressure on deposit rates could impact funding costs.
-
Technology complexity: Aggressive expansion into crypto, blockchain, and AI introduces execution risk and potential regulatory uncertainty.
-
Platform monetization: Technology Platform segment growth has been sluggish. Galileo/Technisys must demonstrate better returns on invested capital.
Competitive & Market Risks:
-
Intense competition: Facing traditional banks (JPMorgan, Bank of America), fintechs (Robinhood, PayPal), and specialized lenders (LendingClub, Upstart). Many competitors have stronger brand recognition or deeper resources.
-
Interest rate sensitivity: Despite diversification efforts, lending economics remain sensitive to rate movements. Margin compression risk if rates rise or competition intensifies.
-
Regulatory uncertainty: Crypto initiatives subject to evolving regulations. Bank charter brings higher regulatory scrutiny and capital requirements.
-
Customer acquisition costs: Maintaining high member growth requires sustained marketing investment. Any deterioration in unit economics would pressure profitability.
Valuation & Market Risks:
-
Valuation premium: 60x P/E and $36B market cap price in sustained high growth. Stock vulnerable to multiple compression if growth disappoints or macro conditions deteriorate.
-
Analyst skepticism: Consensus Hold rating with average target 29% below current price reflects concerns about risk/reward at current levels.
-
Execution expectations: Management raised guidance significantly. Missing targets would likely trigger sharp selloff given elevated expectations.
-
Competition for deposits: Major banks offering competitive rates could pressure SoFi's deposit growth or force higher rates, squeezing margins.
Financial Risks:
-
Balance sheet constraints: Capital ratios will eventually limit loan growth without equity raises, potentially diluting shareholders.
-
Loan portfolio concentration: Heavy exposure to personal loans and student loans creates concentration risk. Any deterioration in these segments would materially impact results.
-
Economic sensitivity: Consumer lending heavily dependent on employment, income growth, and consumer confidence. Recession would pressure all business segments.
Conclusion
SoFi delivered an outstanding Q3 2025 with record financial results across virtually all metrics. The company demonstrated:
-
Accelerating revenue growth at 38% YoY with improving profitability (29% EBITDA margin)
-
Strong credit performance with charge-offs and delinquencies declining or stable
-
Robust member and product growth with 905,000 net member adds and 1.4 million new products
-
Capital strength with tangible book value growing 46% YoY to $5.97 per share
-
Improving competitive positioning through deposit funding advantage and diversified revenue streams
The raised guidance signals management confidence in sustaining momentum. The Loan Platform Business represents a significant growth vector with potential to reach $1+ billion in annual revenue. The deposit base provides a structural cost advantage generating $627 million in annual interest savings versus warehouse facilities.
However, the valuation demands scrutiny. At 60x P/E and 112% YTD gain, the stock has run far ahead of fundamentals. The consensus analyst view reflects this tension—strong operational performance meets stretched valuation. The average price target of $21.30 implies nearly 30% downside, suggesting professional investors view risk/reward as unfavorable at current levels.
SoFi has proven its business model works. The question for investors is price. The company must continue executing flawlessly to justify current multiples. Any stumble on credit quality, member growth, or margin expansion would likely trigger significant multiple compression.
For existing holders, the quarter validates the investment thesis but warrants trimming into strength given valuation. For new money, waiting for a pullback toward $20-24 would offer better risk/reward. The business quality is high, but so is the price.
Valuation: Fair value range $20-25 based on 40-50x forward earnings (2026 EPS estimate ~$0.50)
Current Price: $30.00
Risk/Reward: Unfavorable at current levels
Recommendation: HOLD for existing positions; WAIT for better entry point for new positions
Sources
- https://www.businesswire.com/news/home/20251028756056/en/SoFi-Reports-Third-Quarter-2025-with-Record-Net-Revenue-of-$962-Million-Record-Member-and-Product-Growth-Net-Income-of-$139-Million
- https://www.marketwatch.com/story/sofis-stock-is-on-fire-and-so-is-its-business-these-earnings-numbers-show-why-f8582339
- https://www.stocktitan.net/news/SOFI/so-fi-reports-third-quarter-2025-with-record-net-revenue-of-962-zhxgqlettgwm.html
- https://www.morningstar.com/news/marketwatch/2025102821/sofis-stock-is-on-fire-and-so-is-its-business-these-earnings-numbers-show-why
- https://finance.yahoo.com/news/sofi-q3-earnings-keep-stock-172345269.html
- https://www.datadinvesting.com/p/sofi-q3-preview-why-wall-streets?r=cjqj6&triedRedirect=true
- https://www.datadinvesting.com/p/sofi-q3-earnings-review-onward-and
- https://www.ino.com/blog/2025/02/digital-banking-revolution-why-sofi-technologies-sofi-could-be-a-fintech-leader/
- https://www.benzinga.com/quote/SOFI/analyst-ratings
- https://www.marketbeat.com/stocks/NASDAQ/SOFI/forecast/
- https://www.datadinvesting.com/p/sofi-q3-preview-why-wall-streets
- https://stockstory.org/us/stocks/nasdaq/sofi
- https://seekingalpha.com/article/4827920-sofi-lots-of-catalysts-yet-priced-for-perfection
- https://investors.sofi.com/news/news-details/2025/The-Future-of-Financial-Services-SoFi-to-Offer-Members-New-Crypto-Enabled-Capabilities-to-Get-Their-Money-Right/default.aspx
- https://www.investopedia.com/sofi-is-expanding-its-options-offerings-here-is-what-you-should-know-11822998
What's Your Reaction?
 Like
0
Like
0
 Dislike
0
Dislike
0
 Love
0
Love
0
 Funny
0
Funny
0
 Angry
0
Angry
0
 Sad
0
Sad
0
 Wow
0
Wow
0